EDF files of physiological signals
When we try to learn how to work with time series, it is very useful to have good data sets, and much better if they contain real data. It is difficult to obtain long series, or series presenting interesting and well located and identified patterns, with which we can perform practices. An excellent source of complex time series is our own organism, and everything we can learn by working with them can be extrapolated to any other context.
Perhaps , the signals obtained by electrocardiography (ECG) or electroencephalography (EEG) are the best known examples, but there are many other possibilities, such as the RR series of intervals between beats in an electrocardiogram, series with blood glucose levels, or any other metabolic marker. There are records of signals containing hours of data, with thousands of samples, and collections of signals belonging to different patients with different pathologies.
PhysioNet is an excellent source of this type of data, and it is open access. The signals contained in this database can be downloaded as files in different formats. In this article, I am going to focus on the EDF format, which allows including a whole collection of signals for the same individual. This file format can be read using the R statistical environment, which is free and can be easily downloaded and installed from the R Project site. This environment provides a programming language similar to C, and there are countless libraries for all types of statistical procedures. It also allows exporting data in a large number of formats, so it is an excellent tool, either to work directly with it or as a bridge with any other system with which we usually work.
Not all the files in the PhysioNet database are available in EDF format, but there is an online application to export any of the data sets in this format, it is PhysioBank ATM, and, on the same page, you have an exhaustive explanation on how to use it.
In any case, once we have a file in EDF format, to load it in the R environment it is necessary to load the edfReader library. This library is available for download using the option Install package(s) from the Packages menu. After installing it, we can load it with the following command:
library(edfReader)
Let's download a file having already this format. This, for example, is a database with signals from patients with sleep apnea. The files with extension .rec and .edf are in EDF format. On the page itself, you have an explanation about the signals contained in these files. I will use ucddb003_lifecard.edf, which contains three of the signals that compose a long-term electrocardiogram (Holter).
First, you have to read the header of the data file:
hdr<-readEdfHeader("ucddb003_lifecard.edf")
Then, with this header, you can read the data:
sdata<-readEdfSignals(hdr)
This way, we can see what are the signals contained in the file and some information about them:
summary(sdata)
    Start time            : 2006-01-01 09:03:58
    Ordinary signals:
    Continuous recording : TRUE
    Recorded period      : 29100 sec = 08:05:00 h:m:s
    Period read          : whole recording
     Signals
R/EDF  name/label transducer sampleRate preFilter                       samples
 signal                             /sec
 1     chan 1      Ag-AgCl           128 …                              3724800
 2     chan 2      Ag-AgCl           128 …                              3724800
 3     chan 3      Ag-AgCl           128 …                              3724800
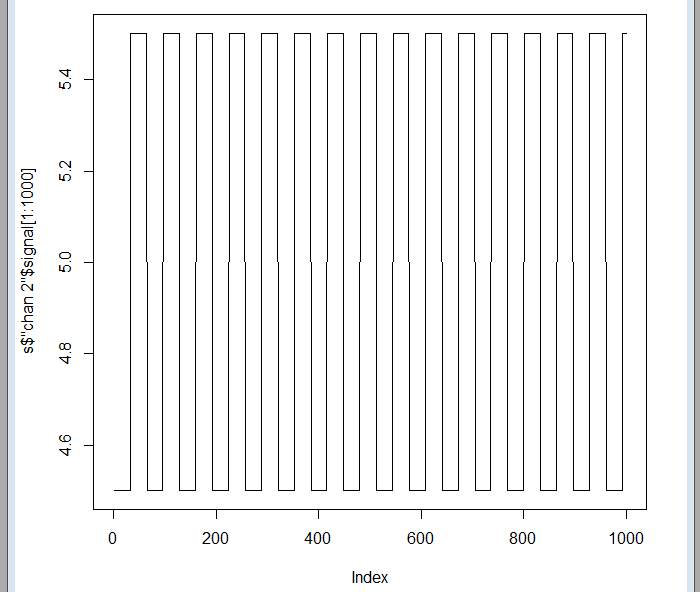
There are three different signals named chan 1, chan 2 and chan 3, corresponding to three ECG channels. It can be verified that the recording lasted 8 hours and 5 minutes, and that each signal contains 3,724,800 samples. If we observe the first samples of any of the signals, we will simply see a square wave. This is used to synchronize the recording device with the data collection center, since the recording is usually done through the telephone line:
plot(sdata$"chan 2"$signal[1:1000],type="l")

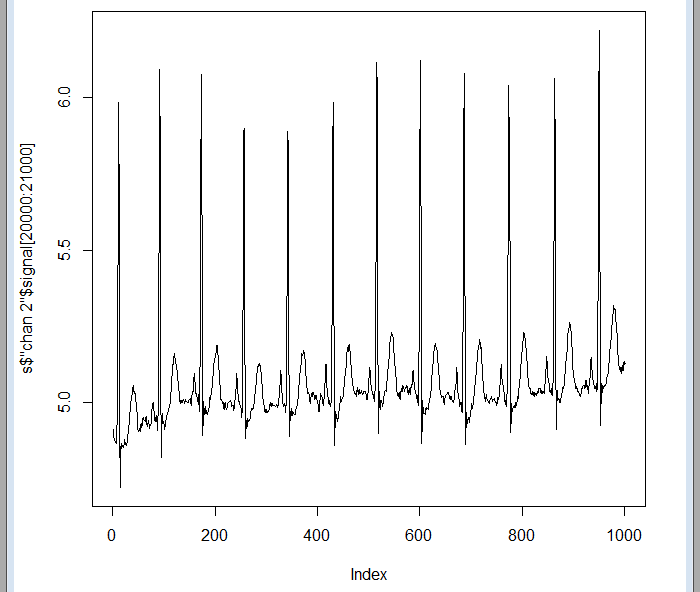
But some indexes beyond, the data is already there:
plot(sdata$"chan 2"$signal[20000:21000],type="l")

As it would happen with any other source of complex data that we want to analyze, it will be necessary to learn something about this type of signals. We have to know how are the different irregularities that we can detect or predict in the signals. For the case of physiological signals, for instance, we are interested on pathologies. This is a personal decision of each one. I, for my part, am going to write articles, from time to time, about ways to work with this kind of signals.


