GPU / Open CL vs. CPU performance
All massive data processing applications can benefit from the ever-increasing processing capacity of modern computers, which is now affordable for anyone's pocket. I will show in this article a basic performance comparison among various CPU / GPU platforms, based on the well-known Mandelbrot set and its surprising graphical representation.
The test consists of drawing the points of the set in a specific interval of the complex plane using different procedures: a single task, a task per point or a task per image line, using the CPU, or a task per image point using the GPU. To do this, I have written an application in C# and C++ with Visual Studio 2022, which you can download using this link. The archive contains the application executable (in the MandelbrotMP\bin\Release subdirectory), the source code, and a CSV file with the test results for different platforms (Performance-data.csv).
To execute the algorithm using the CPU, I have used the Parallel class of the .NET Platform, which allows making loops using the different processor cores in parallel. To use the GPU, I have written a C++ DLL that uses the Open CL API to launch one task for each pixel in the image. I have made the comparison with the following computer configurations, all of them with 16 GB of RAM or more:
- Computer 1: Desktop, i9 9960X CPU (16 cores / 32 threads), AMD Radeon RX 6900 XT, DDR4 2666 MHz, PCIe 3.0.
- Computer 2: Desktop, i9 11980K CPU (8 cores / 16 threads), AMD Radeon RX 5700 XT, DDR4 3200 MHz, PCIe 4.0.
- Computer 3: Laptop, i7 11800H CPU (8 cores / 16 threads), Nvidia RTX 3060, DDR4 3200 MHz, PCIe 4.0.
- Computer 4: Laptop, i7 11800H CPU (8 cores / 16 threads), Nvidia RTX 3050, DDR4 3200 MHz, PCIe 4.0.
- Computer 5: Desktop, i7 9700 CPU (8 cores / 8 threads), Nvidia RTX 2060, DDR4 2666 MHz, PCIe 3.0.
- Computer 6: Desktop, i5 8400 CPU (6 cores / 6 threads), AMD Radeon RX 5500 XT, DDR4 2400 MHz, PCIe 3.0.
- Computer 7: Desktop, i7 10700K CPU (8 cores / 16 threads), Nvidia RTX 3080, DDR4 2666 MHz, PCIe 4.0.
Using the application
The application allows us to carry out two types of tests: drawing a single image from the set, which we can zoom in and out using the mouse wheel, or drawing 100 pictures, each one with a different zoom level, obtaining an effect like this:
The last option is the one that I have used to make the comparison since it allows you to save a CSV file with the times in milliseconds that it takes to calculate each of the images.
After launching the program, the following dialog box appears, which allows you to select the type of test that you want to perform:
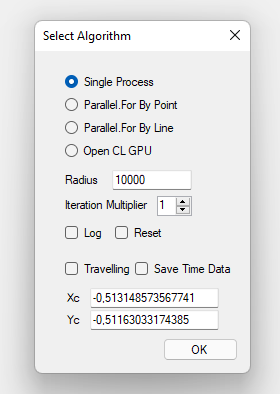
You can choose four different algorithms:
- Single Thread: Draws all images' pixels sequentially, using a single thread.
- Parallel threads per pixel: Draws the image using a separate thread for each pixel.
- Parallel threads per line: Draws the image using a separate thread for each line.
- Use the GPU with Open CL: Draws the image using the GPU with the Open CL API.
The other parameters have the following meaning:
- Log: if checked, the application writes a text file with the different operations performed results (only for the GPU / Open CL option).
- Reset: Restore the image coordinates and zoom to the initial values before starting.
- Travelling: If checked, 100 consecutive images are drawn, centred on the point corresponding to the indicated Xc and Yc coordinates.
- Save Time Data: After drawing the 100 images, save a CSV file with the time spent on each of them in milliseconds.
- Radius and Iteration Multiplier: Parameters to configure the weight of the calculations, as indicated below.
You can open this dialog box again at any time by double-clicking on the main window. You can use the mouse wheel to zoom in and out the image centred in the point pointed by the mouse. Move forwards to zoom in and backwards to zoom out. If you right-click on the main window, the point coordinates are saved to the clipboard and used to set up Xc and Yc when opening the configuration dialog box again.
The tests
We have an image W pixels wide and H pixels high, i.e. W x H pixels. In Full HD, the total is 1920 x 1080 = 2,073,600 pixels (you have to discount the space occupied by the title bar, the window borders, and the taskbar if not hidden). If the resolution is 4k, the pixel count is approximately four times more, i.e. 8,294,400.
To draw the Mandelbrot set, for each point, we have to perform the following operations:
- The complex number corresponding to the point is Z0 = X + iY.
- Calculate the sequence Zn + 1 = Zn2 + Z0, where Zn results from the previous calculation.
- If the modulus of the result is greater than a certain number (the Radius parameter of the configuration dialog box), the number Z0 does not belong to the Mandelbrot set. The colour to draw the pixel depends on the value of n (number of calculated terms of the sequence).
- If the Radius value is never exceeded, the point belongs to the set and is drawn with the colour 0.
The palette has 1786 colours, as follows:

The Iteration Multiplier parameter of the configuration dialog box indicates how many Terms of the series the application will try to calculate, in multiples of the number of colours, to check if the point belongs to the set (black colour).
I have calculated the 100 images using multipliers 1 (1786 iterations) and 4 (7144 iterations) for all the tests. All tests are in Full HD resolution. In computers 1 and 2, I have also used 4k resolution. I have only done the CPU tests with computers 1 and 2, which are the most powerful.
The results
To not bore those who are not interested in the technical details, I will present the results first. I have only executed the single thread test with the most powerful processor (computer 1) since it is clear that it will be notably slower than any of the other options. The boxplot with the results is as follows:
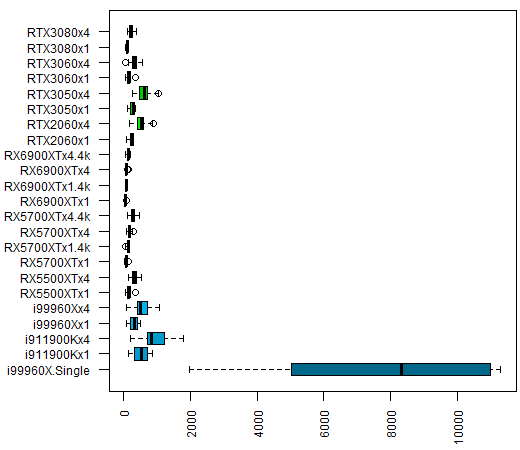
If we remove the single-thread test, the graph looks like this:
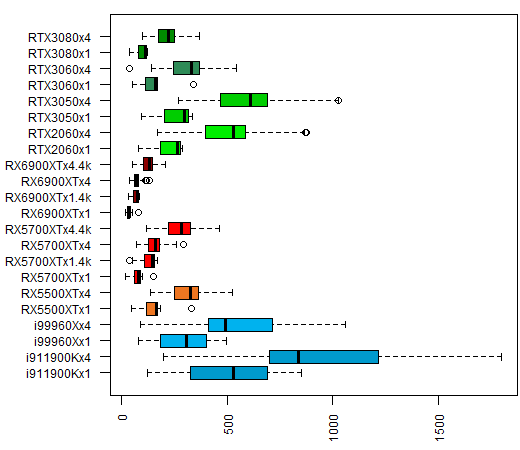
In this graph, we have the CPUs data in blue (Intel) and the GPUs data in reddish (AMD) or green (Nvidia) tones. Each label is formed by the CPU / GPU model, the iteration multiplier (x1 and x4) and the cases with 4k resolution. It is funny that the RX 5700 XT and RX 6900 XT AMD GPUs outperform in this test not only the CPUs, as expected, but also Nvidia GPUs. Even the RTX 3080 one.
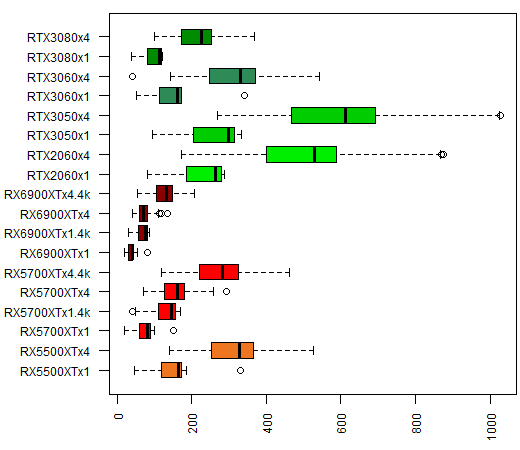
In this other graph, we can see the comparison among GPUs without the CPU data:
As for the total time to compute the 100 images, here is the graph for each of the CPU / GPU (times are in milliseconds, on the vertical axis. Single-threaded execution time is not shown):
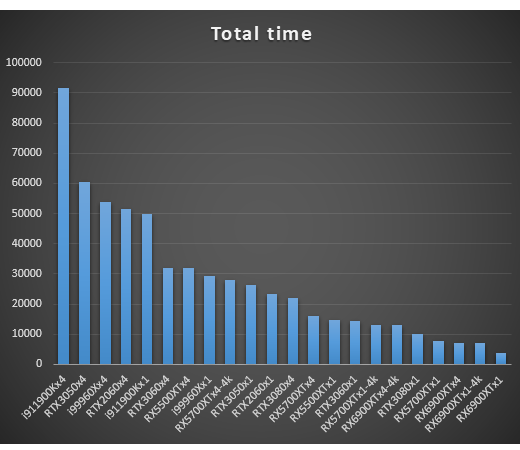
The Radeon RX 6900 XT and RX 5700 XT GPUs are the clear winners, even at 4k, leaving behind the theoretically superior RTX 3080. What is clear is that if the problem we are trying to solve requires a sufficient number of tasks, any GPU far outperforms the best CPU. The reason is that they have a much higher number of threads. In cases where the problem requires only a low thread number, CPUs can be superior to GPUs since they generally have a higher clock speed.
The source code
For those interested in the application source code and want to make modifications to run different tests, these are the points that I consider most relevant:
The algorithm to calculate if a point Z0 = xn + iyn belongs to the set is as follows:
double xx = 0;
double yy = 0;
pt[cp] = _colors[0];
for (int i = 0; i < it; i++)
{
    double x = ((xx * xx) - (yy * yy)) + xn;
    double y = (2 * xx * yy) + yn;
    xx = x;
    yy = y;
    if ((x * x) + (y * y) > r)
    {
         pt[cp] = colors[i / rcol];
         break;
     }
}
The data is stored in the cp array of w x h integers (w = image width, h = image height, in pixels), each of which represents a colour from the palette. We initialize the current point with colour 0 as if it belonged to the set.
For a number it of iterations (the number of colours times the multiplier rcol), we perform the calculation Zn+1 = Zn2 + Z0, if the modulus of the result is greater than the constant r, we give the point the corresponding palette colour, and we move on to the next one.
To draw the image using the CPU, I use the For method of the System.Threading.Tasks.Parallel class. This method transparently makes optimal use of all the CPU cores.
I have used Open CL to compute with the GPU. I have written a C++ library that the program must call to draw the image. The kernel to process each point is in the MandelbrotKernel2.src text file, and it is as follows:
__kernel void MandelbrotKernel(int w, int h, double x0, double y0, double dx, double dy,
    int it, int r, int colorscnt, __constant int* colors, __global int* image)
{
    int gsz = get_global_size(0);
    int cp = get_global_id(0) +
        (get_global_id(1) * gsz) +
        (get_global_id(2) * gsz * gsz);
    if (cp < (h * w))
    {
        int rcol = it / colorscnt;

        double xn = x0 + ((double)(cp % w) * dx);
        double yn = y0 - ((double)(cp / w) * dy);

        double xx = 0;
        double yy = 0;
        for (int i = 0; i < it; i++)
        {
            double x = ((xx * xx) - (yy * yy)) + xn;
            double y = (2 * xx * yy) + yn;
            xx = x;
            yy = y;
            if (((x * x) + (y * y)) > r)
            {
                image[cp] = colors[i / rcol];
                break;
            }
        }
    }
}
The parameters are as follows: w and h are the image width and height in pixels. x0 and y0 are the complex coordinates of the image's bottom-left corner. dx and dy are the width and height of each image pixel. it is the number of iterations. r is the maximum divergence radius; colorscnt is the number of colours. colors is a pointer to the array of colours, and image is a pointer to the image data.
To define the position of each pixel in the image data array, I use the global identifiers of the three dimensions of the GPU workspace. I calculate these values based on the total number of pixels in the image, as follows:
cl_uint ndim = 3;
int nbits = (int)ceil(log2(imgsz));
nbits = (nbits / ndim) + ((nbits % ndim) ? 1 : 0);
size_t globalWorkSize[3];
globalWorkSize[0] = (size_t)1 << nbits;
globalWorkSize[1] = (size_t)1 << nbits;
globalWorkSize[2] = 1 + (imgsz / (globalWorkSize[0] * globalWorkSize[1]));
We get the number of bits per dimension (nbits) by calculating the logarithm in base two of the image size (imgsz) and dividing it by the number of dimensions. This way, we can represent the total size with three digits in base nbits, one for each dimension.
This calculation is not optimized, so there may be extra elements above the number of pixels in the image. For this reason, the if (cp < (h * w)) check is necessary before performing any operations.
The C++ library MandelbrotMPOpenCLGPU.dll exports four functions:
- MSGPUImage: Performs all the operations necessary to draw an image, allocating and releasing resources in a single call.
- MSGPUPrepare: Allocates resources to use the GPU. It does not draw any image. Call this function for initialization before performing the 100 images test.
- MSGPUFrame: Draws an image with the resources allocated by the previous function.
- MSGPURelease: Release the Open CL resources.
The ContextData structure stores the Open CL resource handles for the GPU:
public struct ContextData
{
    IntPtr kernel;
    IntPtr program;
    IntPtr cmdQueue;
    IntPtr imgBuffer;
    IntPtr colorBuffer;
    IntPtr gpuDevice;
    IntPtr context;
};
Regarding the choice of GPU, the library selects the one with the higher product of the parameters CL_DEVICE_MAX_COMPUTE_UNITS and CL_DEVICE_MAX_WORK_GROUP_SIZE. This procedure should guarantee the use of the device with the highest power, which usually will be the dedicated graphics card.
And that's all for now. I hope you enjoy the code making modifications to implement new tests of your own.


