Random numbers generation
In many applications it is necessary to generate random numbers. To do so, the .NET framework provides the Random class, which can generate uniformly distributed pseudo-random values, which means that all numbers are equally likely to appear in the result. But in some cases we need to generate random values that follow other different types of distribution. In this article we will see how to generate random numbers that follow a normal distribution, with a system that can be extended to any other type of distribution.
There are several different systems for generating numbers with a Gaussian distribution, for example the Box-Muller transformation, with different variants, as the Marsaglia polar método. In this link you can download sample code using Box-Muller method.
Another method, more efficient but more complex is the ziggurat algorithm, in which I have based to develop the code of this article. Basically it consists of dividing the area under one half of the normal distribution in rectangles with the same area and decreasing heights and, then, select one of them using a uniform distribution. Then, the length of the base of the rectangle is multiplied by a random number between 0 and 1, if the result is within the part of the rectangle that is contained entirely within the distribution curve, this value is returned, or, otherwise, it continues to sampling within the rectangle until the condition is met. A special case is the rectangle in the base, since the values in the queues of the distribution tend to infinity, so you need to implement a special processing if this is the selected rectangle.
These methods were designed in the 60s of last century, when computer memory was a scarce and expensive resource, so they use loops until they find the result or mathematical operations that are costly in processing time of the processor. Currently, memory has become cheaper and in any computer there are installed several gigabytes, so we can optimize all these procedures by using tables of pre-calculated values. This is the method I follow in the sample code I present here. In this link you can download the project with the sample code to generate random numbers with normal distribution. The project is made with Visual Studio 2013.
Instead of dividing the surface of the distribution function in rectangles with decreasing height, we divide the height of the curve in a sufficient number of points and we store the value of the x coordinate corresponding to each of them. This is equivalent to constructing a series of rectangles whose height tends to one. The idea of building rectangles of decreasing height is that top boxes are more likely to be selected as being of greater height when a random value for the y coordinate is selected, what we will do here is to use a second normal distribution, which will provide a value to select the coordinate, producing the same effect.
The problem of selecting values in the tails of the distribution will be solved limiting the returned values to a range of n standard deviations, thus avoiding the possibility of reaching infinite values.
All necessary calculations are performed in the constructor of the class, so that the generation of random values does not use any loop or any complex or costly calculation in processor time.
This is the constructor of the RandomNormal class:
public RandomNormal(int resolution, int seed, double sdmax, double mean, double sd)
{
    if (seed > 0)
    {
        r = new Random(seed);
    }
    else
    {
        r = new Random();
    }
    _mean = mean;
    _sd = sd;
    if (sdmax <= 0)
    {
        sdmax = 1;
    }
    _stack = new double[resolution];
    ConstructNormal(_stack, resolution, sdmax, sd);
    _sampler = new double[1000];
    ConstructNormal(_sampler, 1000, 3, (double)resolution / 3);
}
In the parameter resolution you will pass the number of divisions to perform on the y axis and in the seed parameter you have to pass an initial value for the random number generator Random class used internally or 0 if you do not want to initialize it. sdmax indicate the number of standard deviations within which we want to generate results, and mean and sd are for the mean and standard deviation of the distribution.
The _stack variable is an array of values of type double that contain the x coordinates of the normal curve in each of the points of the y axis, while _sampler will be filled with data from the normal distribution for sampling, with a range of three standard deviations and with a standard deviation equal to the third part of the resolution that we have indicated, so that the returned values are in the range of the size of the _stack array. The data contained in these arrays are for a distribution with a mean of 0, the real mean will be added when the random numbers are generated.
The ConstructNormal function performs the calculating of the data distribution:
private void ConstructNormal(double[] data, int resolution, double sdmax, double sd)
{
    double xmax = Math.Round(sd * sdmax, 10);
    double gamma = Math.Round(sd * Math.Sqrt(2 * Math.PI), 10);
    double ymax = Math.Round(1 / gamma, 10);
    double ymin = Math.Round(ymax * Math.Exp(-0.5 * sdmax * sdmax), 10);
    double yincr = Math.Round((ymax - ymin) / (double)resolution, 10);
    data[0] = 0;
    double y = ymax - yincr;
    for (int layer = 1; layer < resolution; layer++)
    {
        double x = Math.Round(sd * Math.Sqrt(-2 * Math.Log(gamma * y)), 10);
        data[layer] = x;
        y -= yincr;
    }
}
For each of the divisions of the y axis, starting with the highest, we calculate the x coordinate using the inverse function of the normal distribution function. The first value will be assigned directly to the media, as it will always be 0, and we begin to be calculated from the next level.
Finally, the generation of random numbers is extremely simple. It is performed with the NextValue function:
public double NextValue()
{
    int slayer = r.Next(_sampler.Length);
    int layer = (int)_sampler[slayer];
    double mult = r.NextDouble();
    double sgn = r.NextDouble() >= 0.5 ? 1 : -1;
    return Math.Round(_mean + (mult * _stack[layer] * sgn), 10);
}
First we select a random value for the sampling normal distribution, corresponding to one of the layers of the target distribution. The value in this layer is multiplied by a random value between 0 and 1, and we obtain also a sign to select one of the two sides of the distribution. Finally, we return the result centered on the true mean of the distribution.
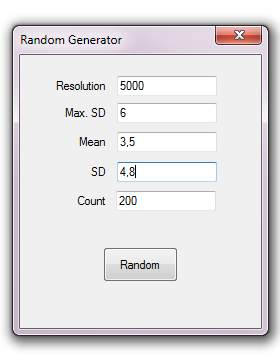
Now let's see how to use the small sample application to generate random numbers and perform normality tests using the R program.

First, we introduce the appropriate parameters, with whose values we can play until you find the most appropriate for the distribution, which will depend mainly on the selected standard deviation.
Pressing the Random button, as many values as indicated in the Count box are calculated and copied to the clipboard, as an executable command in R code, assigning them to the test variable.
Then you can run the command in R pasting it from the clipboard pressing Ctrl+V.
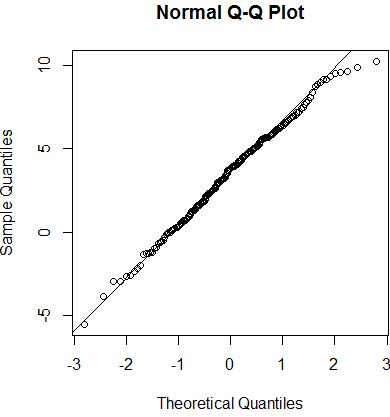
We start doing a Q-Q plot graph to perform a visual test:
qqnorm(test)
qqline(test)

We can perform a test of normality, as the Shapiro-Wilk test:
shapiro.test(test)

        Shapiro-Wilk normality test

data:  test
W = 0.99358, p-value = 0.5397
The high p-value clearly indicates that the data comes from a normal distribution. We will generate a sequence with R of the same features to compare:
rn<-rnorm(200, 3.5,4.8)
shapiro.test(rn)

        Shapiro-Wilk normality test

data:  rn
W = 0.99379, p-value = 0.5703
As you can see, our algorithm stands out quite well in comparison.
You can apply this same system to any type of distribution of which we desire to obtain sequences of random numbers, it is fast and fairly accurate, given the multiple possibilities of parameterization it have.


