Complex time series II, web diagrams
I continue the series on graphic characterization of the complexity in time series using the helper application GraphStudy. In this article I will show how to construct a graph with which you can easily distinguish whether a particular series from an iterated function presents a chaotic dynamics, the web diagram.
If you want to start the series at the beginning, this is the link to the first article of the series on graphic characterization of complex time series. In this other link you can download the executable and source code of the GraphStudy project, written in CSharp with Visual Studio 2013.
Continuing with the logistic equation, which, remember, generates the following series:
Xn+1 = µXn(1-Xn)
Which presents periodic dynamics when μ has a value between 3 and approximately 3.5, and chaotic dynamics from this latter value, you can generate the following diagram:
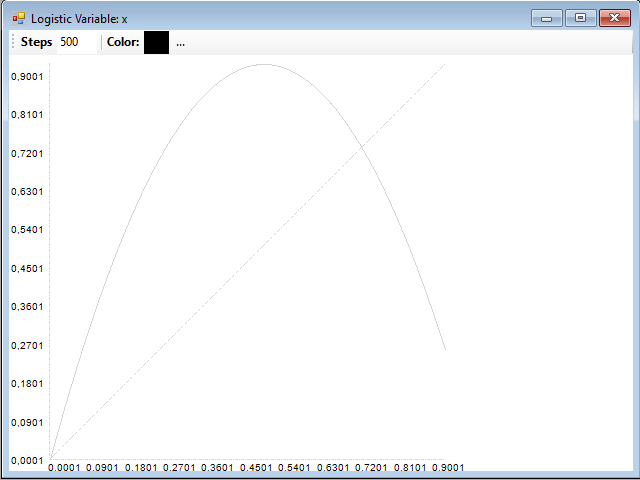
The parabola represents the value of the function Xn from the values between the minimum and maximum value of the series, given a certain value of the parameters. In the case of GraphStudy, the procedure for obtaining this graph is to first generate the time series, with the Series button, and then use the Web button to generate the web graph. In GraphStudy the full parabola is not drawn, but only the part of it where the function takes values with the given parameters and initial values.
In the graph, there is also drawn a diagonal line representing the points where the abscissa and ordinate have the same value.
The horizontal axis corresponds to the values of Xn, whereas the vertical represents the value of Xn+1. Thus, taking any Xn point, you can draw a vertical line up to the corresponding value of Xn+1, located on a point in the parabola.
Then, a horizontal line is drawn from this point to the diagonal line. The direction of this line depends on the side of the parabola in which is the starting point. With this, the point is placed again on the horizontal axis, on the new Xn. Then, a new vertical line is drawn again from here to the corresponding Xn+1 point on the parabola.
After repeating this process numerous times, you obtain a characteristic figure indicating if the series converges to a single value, has one or more periodic cycles, or seems that it tends to cover the entire graph, indicating a chaotic dynamics.
To draw a web diagram, first you must generate the series with the desired parameters and initial value and then click the left mouse button on the web diagram at the point where you want to start to draw the diagram. You can select the number of steps you want to perform, writing it in the text box Steps, and select the color you want to draw the graph.
Giving the μ parameter a value within the area of stationary dynamics of the series, for example 2.5, you obtain the following diagram:
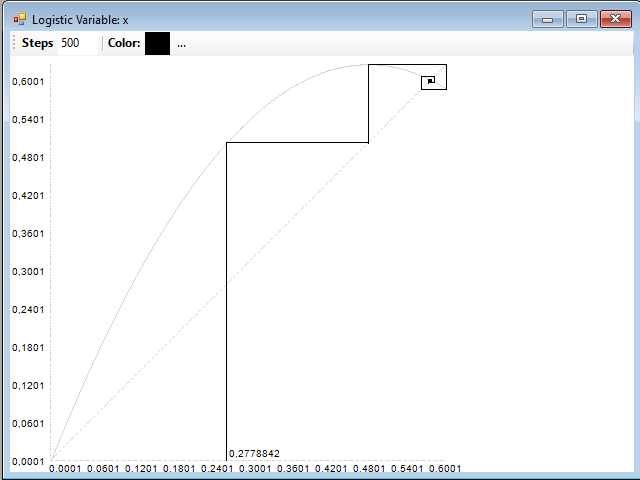
Where it can be seen that the series converges to a single point. If now you give a value in the periodic zone, for example 3.3, you obtain the following diagram:
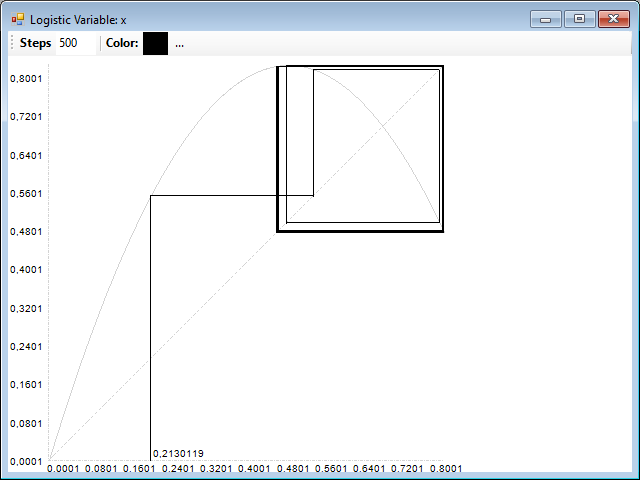
Where it can be seen that the series just draws a square, continuously bouncing between two fixed values.
If now you give to μ a value in the area of chaotic dynamics, for example, 3.8, you obtain the characteristic diagram of this dynamic, an erratic path that passes virtually for all points on the graph:
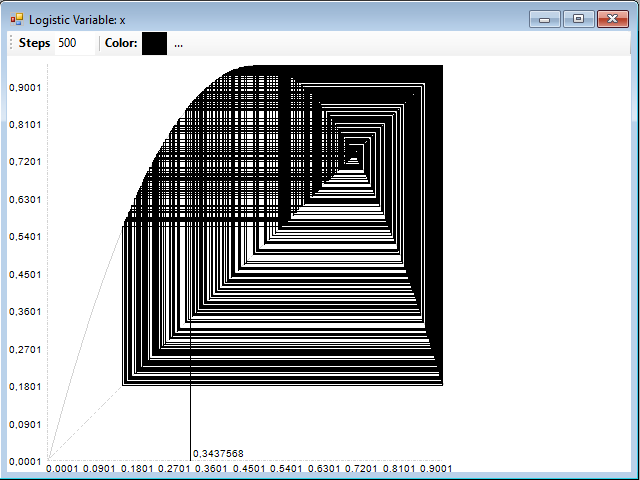
The triangular application
We can review another example of series presenting different behavior in terms of its parameters, the triangular application. This is the formula:
Xn+1 = µ(1-2abs(0,5-Xn))
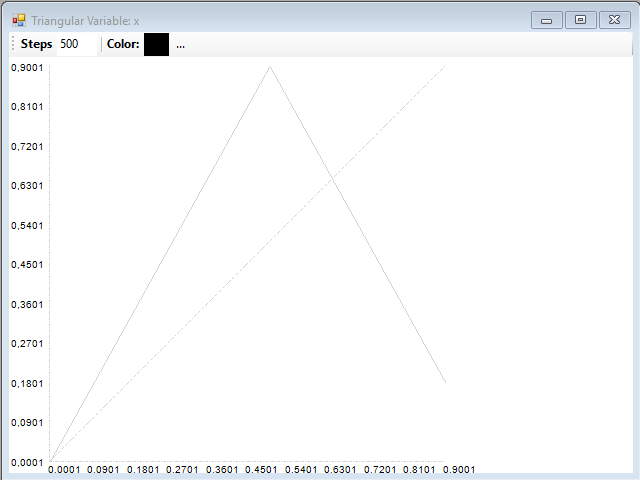
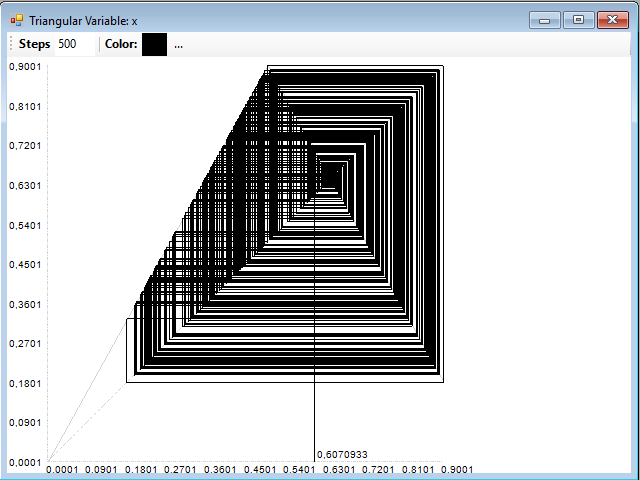
Giving to μ values in the interval (0, 1). If you give μ a value less than 0.5, the system is stationary; the series converges to a single value. However, with values greater than 0.5, always present chaotic dynamics. This is the basic diagram of this application:
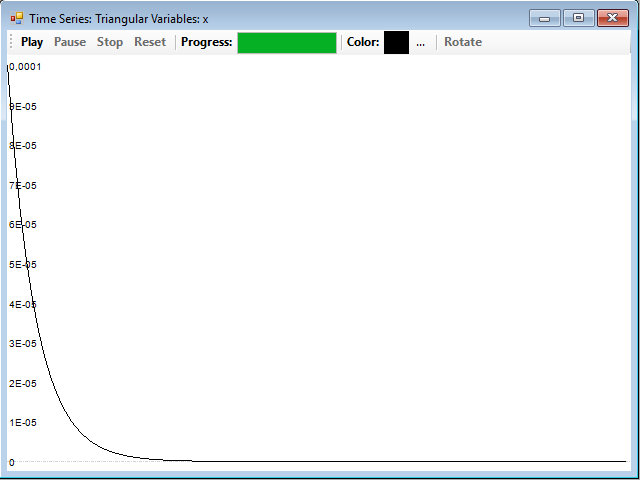
With μ = 0.4 and an initial value for X of 0.0001, you obtain a series which converges to 0:
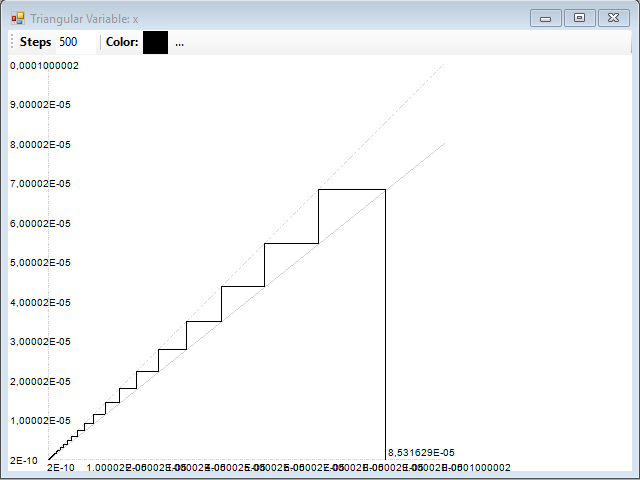
And the corresponding web diagram also indicates this:
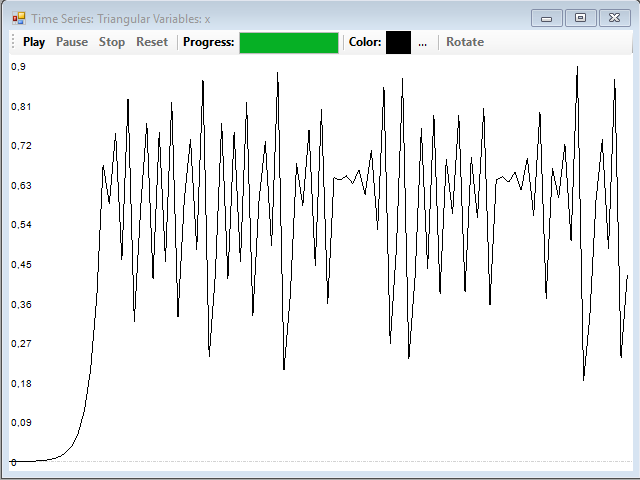
However, with μ = 0.9, the things change a lot. This is the series, with an initial value of 0.1:
And this is the web diagram, which clearly indicates the presence of chaos:
With the R program, you can draw these graphs easily, for example with the following code:
fweb<-function(u,x) {
    return (u*x*(1-x));
}
webdiagram<-function(p, steps=500) {
    xn<-seq(0,1,length.out=1000);
    xn1<-sapply(xn,fweb,u=p);
    plot(xn,xn1,type='l',col="red");
    lines(xn,xn,lty=4);
    x0<-runif(1);
    xn<-x0;
    xn1<-0;
    for (i in 1:steps) {
        xf<-fweb(p, x0);
        xn<-c(xn,x0);
        xn1<-c(xn1,xf);
        xn<-c(xn,xf);
        xn1<-c(xn1,xf);
        x0<-xf;
    }
    lines(xn,xn1);
}
Inside the function fweb you can write the operations that will generate the series, the web diagram is drawn with the webdiagram function. In this case, we are considering functions with a single parameter, but the code can be easily modified to use an arbitrary number of parameters.
Finally, I will recommend you a book that is a classic, where you can find more about this and many other topics: Fractals Everywhere, from Michael F. Barnsley.
The next article in the series will focus on phase diagrams and attractors.


