Drawing Fractals with Iterated Function Systems (IFS)
The Iterated Function Systems (IFS) are a simple mathematical tool for constructing fractal sets through a series of contractive affine applications. This method was developed by M.F. Barnsley in 1985. In particular, it is useful to obtain a self-similar fractal based on iteratively applying the system of functions to any set, until arriving at a good approximation of the fractal set that constitutes the attractor of the system.
The IFS also serve as a basis for some data compression methods, especially images, since they allow obtain good approximations of objects of the real world. Instead of storing all the data of the images, what we store in its place are the coefficients of the applications of the different systems used to approximate the image, which is then reconstructed from them.
In this article I will use an application to show the operation of this method, with which you can define transformation systems and get images of the fractals generated by iterating them. In this link you can download the source code and executable of the IFSDrawer project, written in CSharp with Visual Studio 2015.
Contractive affine applications
I will explain a little what it is that of contractive affine applications. The examples I am going to use are for a space of two dimensions, a plane, but they can be extended to spaces of any dimension.
An affine application F on a point (x, y) of the plane can be represented as follows:

The e and f coefficients have an obvious function: that of displacing the x and y coordinates. With the other four coefficients, we can perform different operations, whose meaning is best seen if we imagine that we are dealing with the points of a given plane figure.
If we give the b and c coefficients a value of zero, the coordinates x and y of the points will be multiplied respectively by the value of the a and d coefficients, which will cause the figure to expand or contract in each of the two axes.
We can also create a symmetry with respect to the horizontal and/or vertical axes by making one or both a and b coefficients negative.
If we give a value of zero to the a and d coefficients, we can interchange, besides multiplying by the value of the coefficients b and c, the horizontal and vertical coordinates.
Also we can rotate the figure an angle φ giving the following value to the coefficients: a=cosφ, b=-sinφ, c=sinφ and d=cosφ.
We can compose several of these movements obtaining the product of the matrices corresponding to each one of them. Let us recall that the result of the product of two 2x2 matrices A and A' is another matrix A'' whose coefficients are: a''= aa' + bc', b''= ab' + bd', c'' = ca'+ dc' and d'' = cb'+ dd'.
An affine application is contractive if the coefficients by which we multiply are less than one and greater than zero.
In .NET framework it is very easy to perform affine transformations using the Matrix class, in the System.Drawing.Drawing2D namespace.
Iterated Function Systems
The iterated function systems are sets of n contractive affine transformations. Normally, two types of algorithms are used, the deterministic version or the random one.
The deterministic algorithm consists in taking a set of points, which can be any geometric figure, and applying to it each of the n affine transformations of the system, whereby we obtain n sets of transformed points. To each of them we re-apply each of the n functions, obtaining n2 new sets of points.
We continue this way by iterating on the results, until the union of all the sets obtained in the last iteration is approaching sufficiently the figure that constitutes the attractor of the system. We will always arrive to this attractor, regardless of the starting selected set of points. Each IFS has a characteristic attractor, which will be a self-similar fractal, since it is built on copies of itself, smaller and smaller. Normally, it does not take many iterations to obtain such fractal set.
The random algorithm is similar, but instead of applying the functions to a set of points, we apply them to a single point again and again, drawing the result each time. We assign a probability value to each of the system transformations, taking into account that the total sum of the probability values of the functions must be 1. In each iteration of the algorithm, we select one of the transformations with probability p. This is very simple to do, simply get a random value between 0 and 1, for example with the class Random, and go adding the probabilities of each function one by one until the result is greater than the random number obtained. That will be the selected function.
The first points of the series are discarded. Because they are usually very far from the attractor, the rest are plotted until the corresponding fractal drawing is obtained, usually after a number of iterations between 1000 and 5000.
IFSDrawer application
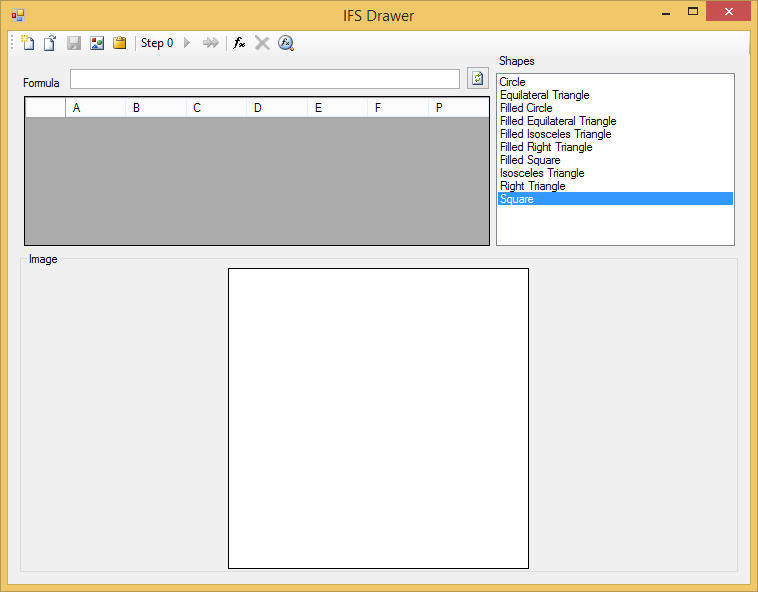
Let's now see the application that I have prepared to illustrate all this. It is a form that looks like this:

In the Shapes list on the right, you can select different starting polygons to iterate through the deterministic algorithm. At the bottom we will see how the attractor is drawn. The coefficients of the different transformations will be written in the DataGridView on the left, which is a DataGridView with formula support that I have already discussed in another article.
The formulas can be written in the text box above the grid and, with the button to the right, they can be compiled and assigned to the selected cells. These formulas can be useful in order to not having to use the calculator to calculate the values to write in each of the coefficients. You can consult the article on this control over the syntax of the formulas. In this application I have added to the language the following constants, which can also be used in the formulas:
- _pi and _e: The values for the math constants pi and e.
- _rand: A random value between 0 and 1.
- _width and _height: The width and height of the drawing zone.
The first button, starting at the left of the toolbar, is to clear everything and start with a new empty system of functions. With the second you can open a file with a system of transformations that you have previously saved. The program works with two formats, csv and a proprietary binary format, ifs. The functions defined in the grid cells are also saved in these two file types along with the rest of the data.
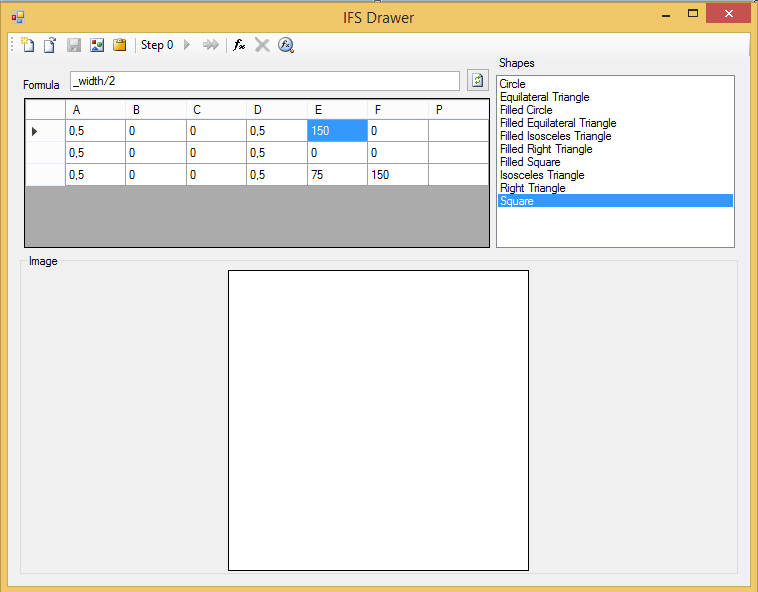
In the Samples folder of the IFSDrawer project I have left some examples of systems. If you open, for example, the Sierpinski.ifs file, you will see the following:

There are three transformations, each one in a grid row, with their corresponding coefficients. Since the P column is empty, the deterministic algorithm will be used to process the system.
The third button on the toolbar allows you to save the transformation system to a file and the fourth and fifth are used to save the current image to a file or to the clipboard, respectively.
You can add more functions to the system with the third button, starting at the right, or delete one of them with the second, after having selected the corresponding row.
Before you can execute the algorithm, you have to process the values in the grid cells, to check that they are complete and correct. To do this you have to use the first button, starting from the right. You should also use this button if you have made any changes, before you can see the result.
Once this is done, one of the central buttons will be activated, with a green arrow, and you can begin to iterate the algorithm, one step at a time, each time you press the arrow.
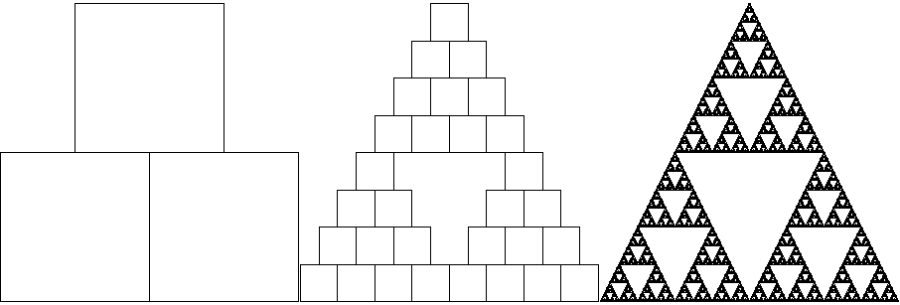
The result, after 1, 3 and 8 iterations, is the following:

The well-known Sierpinski triangle. You can try with any of the other shapes, even with the circle, and you will always get this triangle, which is the attractor of this system of functions.
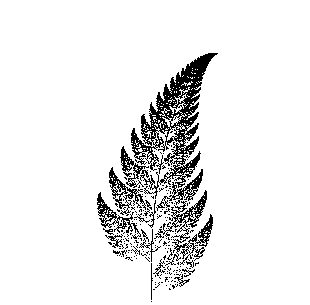
To see an example of a random algorithm, you can open the example file Fern.ifs, with which you can draw a fern leaf. First you have to press the same button as in the previous example to process the formulas. You can see that, in the middle, this time is activated a button with two green arrows, next to which two text boxes appear. The first is for the number of iterations. It should be noted that in this algorithm you cannot go step by step due to the large number of times it should be executed. You can also indicate a scale factor for the drawn figure. The result is something like this:

As for the program code, the Transformation class is used to store the data of each affine transformation in its A, B, C, D, E, F and P properties with generic object type, which can contain values of type double or formulas of the FormulaBase type. The value is retrieved in double format with the read-only properties AValue, BValue, etc:
[Serializable]
public class Transformation
{
    public Transformation()
    {
    }
    public object A { get; set; }
    public object B { get; set; }
    ...
    public double AValue
    {
        get
        {
            if (A == null)
            {
                return double.NaN;
            }
            if (A is FormulaBase)
            {
                return (A as FormulaBase).Value;
            }
            return (double)A;
        }
    }
    ...
}
The class is decorated with the Serializable attribute so that we can save it to a file.
The geometric shapes are all descendants of the abstract base class ShapeBase:
public abstract class ShapeBase
{
    protected GraphicsPath _path;
    protected bool _fill = false;

    public ShapeBase()
    {
    }
    public ShapeBase(ShapeBase clon, Transformation tr)
    {
        _path = clon._path.Clone() as GraphicsPath;
        Transform(tr);
    }
    public abstract void SetInitialSize(SizeF sz);
    public virtual ShapeBase Draw(Graphics gr, Transformation tr)
    {
        if (tr != null)
        {
            ShapeBase snw = GetType().GetConstructor(
                new Type[] { typeof(ShapeBase),
                    tr.GetType() }).Invoke(new object[] { this,
                        tr }) as ShapeBase;
            snw.Draw(gr);
            return snw;
        }
        else
        {
            Draw(gr);
            return this;
        }
    }
    protected virtual void Transform(Transformation tr)
    {
        Matrix m = new Matrix((float)tr.AValue, (float)tr.BValue,
            (float)tr.CValue, (float)tr.DValue,
            (float)tr.EValue, (float)tr.FValue);
        _path.Transform(m);
    }
    protected virtual void Draw(Graphics gr)
    {
        if (_path != null)
        {
            if (_fill)
            {
                gr.FillPath(Brushes.Black, _path);
            }
            else
            {
                gr.DrawPath(Pens.Black, _path);
            }
        }
    }
}
The class has a _path variable of type GraphicsPath, where you define the lines and points with which you draw the shape. The SetInitialSize method is used to initialize the shape with a given initial size. This method is only called once, when creating the object, with the total size of the drawing area. Each shape must create and initialize the corresponding GraphicsPath object in this method.
The parameterized constructor is used to create a copy of another shape and apply a transformation to it. The transformation is applied with the Transform method, which simply creates a Matrix object and applies the transformation to the GraphicsPath with its Transform method.
The shape is drawn by calling their Draw method, to which is passed the Graphics object where it should be drawn and a Transformation that should be applied. If this second parameter is null, the shape is simply drawn on the Graphics, otherwise, a copy is created and the transformation is applied to it, then it is drawn and it is returned as a result of the method.
Defining any shape is very simple; just implement the SetInitialSize method and a version of ToString so that the shape name appears in the list of the main form. In the Load event, the IFSForm form is responsible for listing all the classes of the assembly that descend from ShapeBase and add them to the list, so there is no need to do anything else. This is, for example, the implementation of a square:
public class Square : ShapeBase
{
    public Square()
        : base()
    {
    }
    public Square(ShapeBase clon, Transformation tr)
        : base(clon, tr)
    {
    }
    public override void SetInitialSize(SizeF sz)
    {
        _path = new GraphicsPath();
        _path.AddRectangle(new RectangleF(0f, 0f,
            Math.Min(sz.Width, sz.Height),
            Math.Min(sz.Width, sz.Height)));
    }
    public override string ToString()
    {
        return "Square";
    }
}
And that's all. To further explore the subject, I can recommend the book Fractals Everywhere, by M.F. Barnsley, where you can find a more rigorous mathematical development of the IFS, and the classic Fractal Geometry of Nature, by Benoit Mandelbrot.


